
Broadcast Graphics · Visual Storytelling · Data Visualization
Role: Designer

At CNN, I was part of the design team creating live broadcast graphics seen by millions of viewers. My work ranged from election coverage and breaking news to feature segments, maps, and charts.
The work demanded speed, precision, and creative thinking. Working closely with producers, editors, and fellow designers, I translated developing stories and complex information into visuals that helped viewers follow the news as it unfolded.
CHALLENGES
I often had only minutes to turn a developing story into a graphic ready for air. That meant making quick decisions about what to emphasize, keeping information accurate and readable, and adapting as the story changed—all within CNN’s established visual standards.
GOALS
Make information clear: Use hierarchy, typography, imagery, and data visualization to help viewers understand the story at a glance.
Support live production: Collaborate with the newsroom to adapt graphics as information changed and deliver assets ready for broadcast.
ACCOMPLISHMENTS
Supported major news coverage: Created broadcast graphics for the 2020 presidential election, the COVID-19 pandemic, George Floyd protests, and coverage of the Capitol insurrection.
Contributed across CNN programming: Designed for Anderson Cooper 360, The Lead with Jake Tapper, The Situation Room with Wolf Blitzer, CNN Newsroom with Brooke Baldwin, and Erin Burnett OutFront.
Supported live coverage during lockdowns: During city lockdowns, I was authorized to travel on site to support live broadcasts. That responsibility was another part of working in a newsroom that had to keep delivering as circumstances changed.
REFLECTIONS
Working at CNN was a career-defining experience, equal parts adrenaline and pride. Seeing my work on air made the pace and pressure tangible: each graphic had to help people understand a story as it unfolded. The experience strengthened how I collaborate, make design decisions under pressure, and balance creative thinking with accuracy.
CNN MAGIC WALL
I built the U.S. map shown behind Wolf Blitzer for CNN’s Magic Wall. Designed for live election coverage, it allowed state colors to be changed and labels to be shown or hidden as the story developed.

ELECTION & DEBATE GRAPHICS
Election coverage brings candidate information, results, and key dates into a clear visual hierarchy. The debate graphic below organizes a large field of candidates while keeping the event details prominent.

FEATURE GRAPHICS
Feature segments use a different visual pace from breaking news. This Apollo 11 composition combines astronaut portraits, a launch image, and the lunar surface to establish the story, with space for the broadcast headline and CNN identification.

DATA VISUALIZATION
Maps and charts turn changing COVID-19 figures into information viewers can compare quickly. Clear labels, contrasting colors, and consistent layouts distinguish locations and measures while keeping sources visible. These examples show the data as presented at the time of coverage.
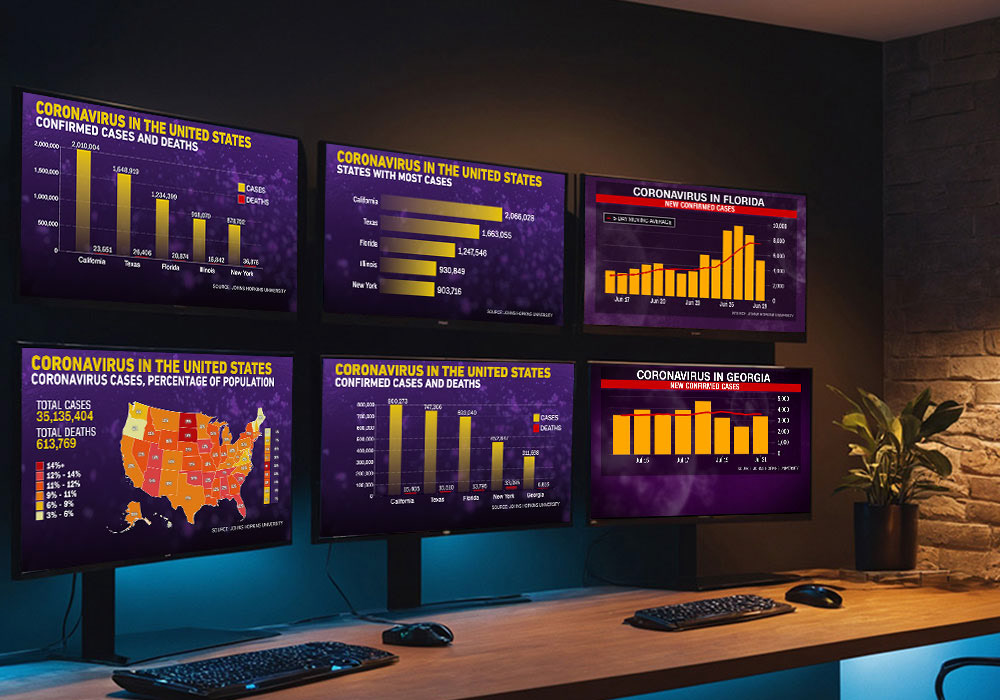
SELECTED BROADCAST GRAPHICS
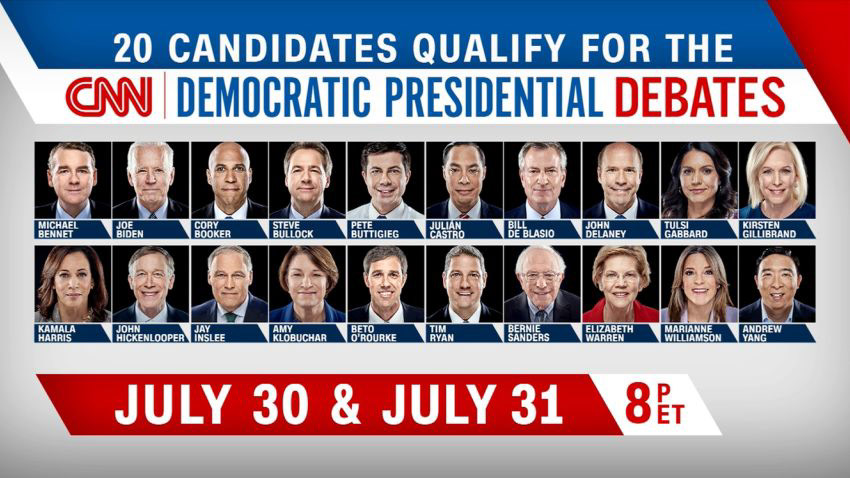
CNN Debates
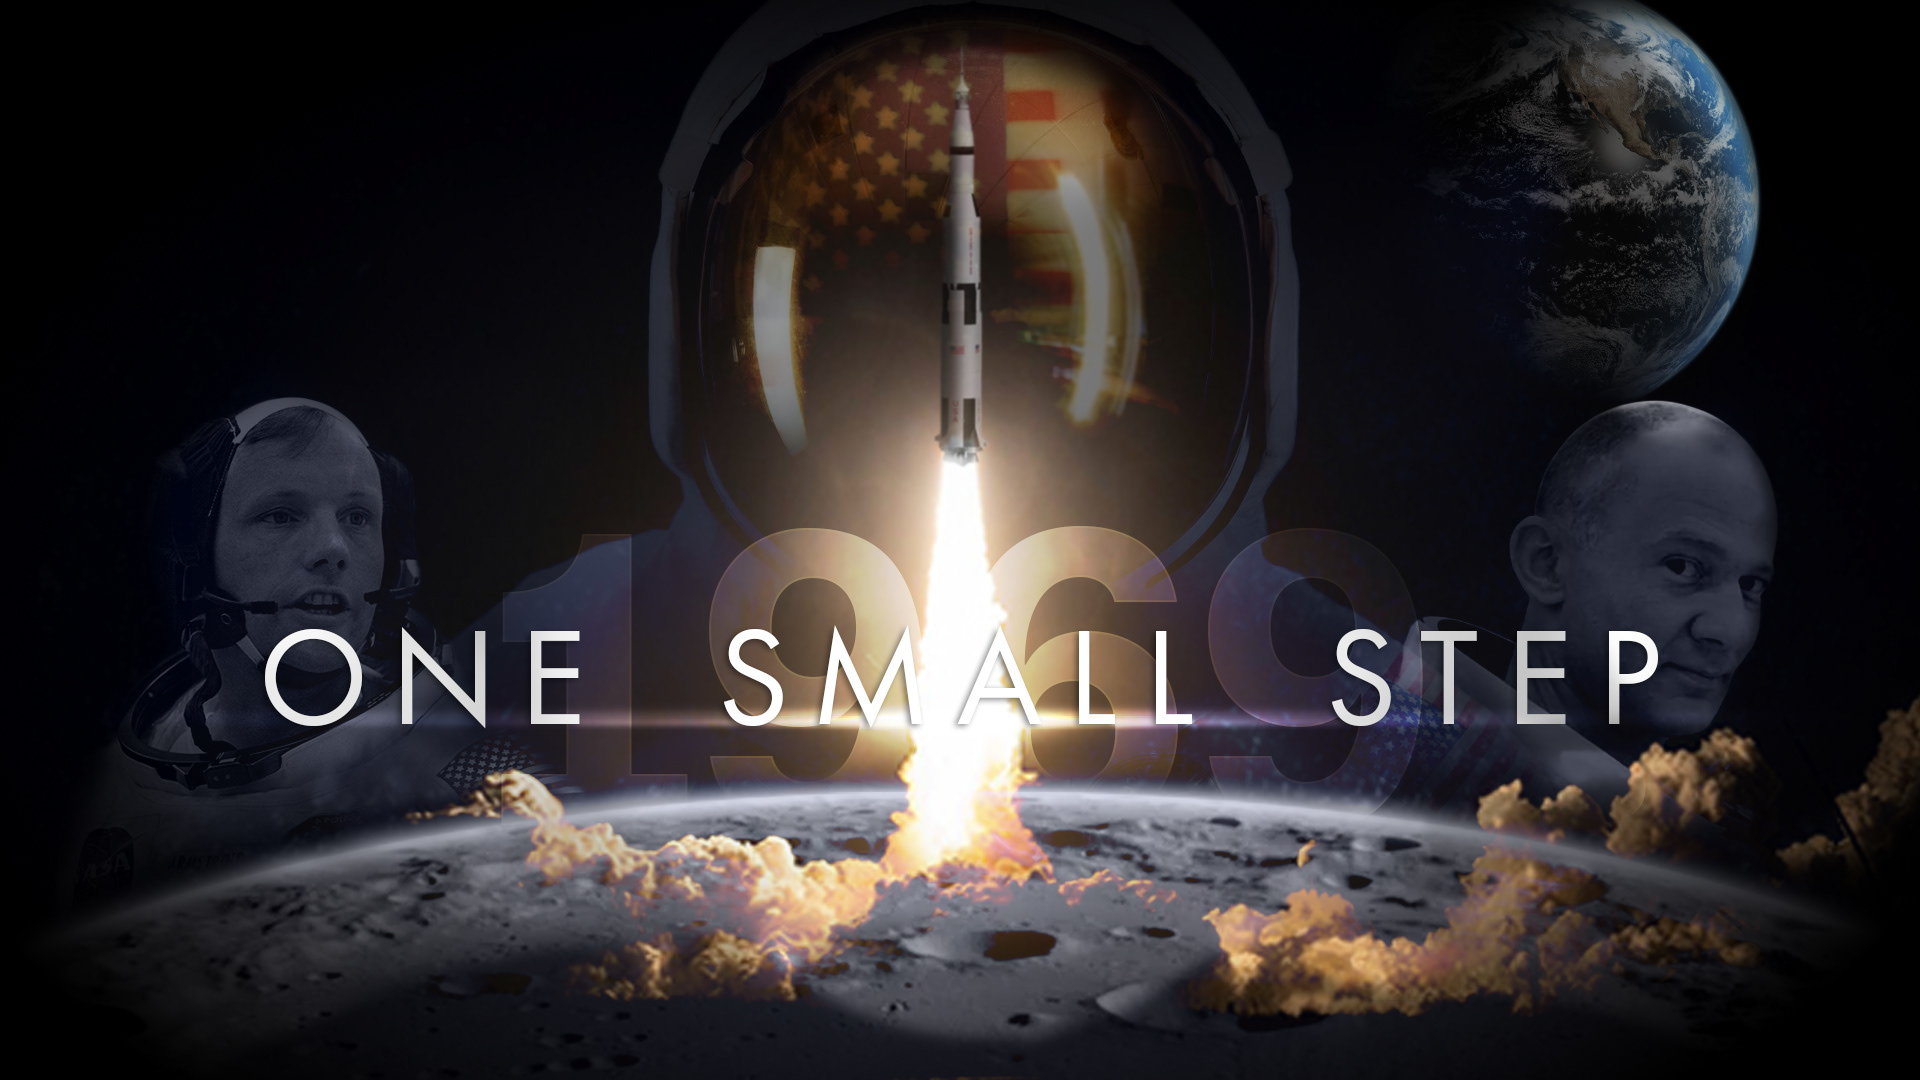
Graphic Monfill

Coronavirus Map
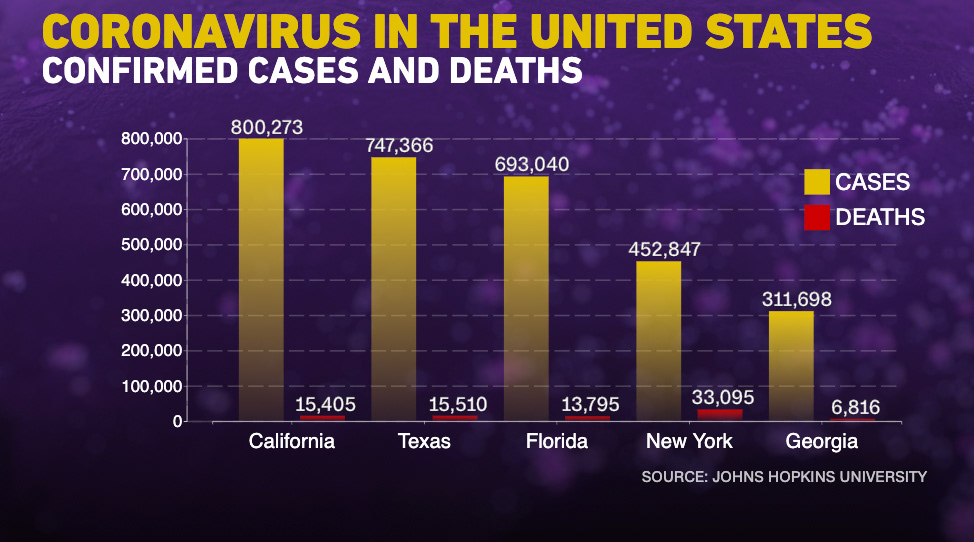
Coronavirus Bar Graph
INTERESTED IN WORKING TOGETHER?


